The NBA's Last Year Is Worth a +65. The Pacific Northwest's La Niña Is Worth a Minus 19.
A reader pushed back on this newsletter's predictability comparisons. Lag-one autocorrelation, last week's metric, is the natural predictor for a sports league because the players carry over. It is not the natural predictor for snowfall — for that, you would use the El Niño-Southern-Oscillation state of the upcoming winter. We rebuilt the chart on each domain's own best-known test and switched the axis to a number a reader can bite into: the predictor's correlation with the outcome, on a scale of negative one hundred to positive one hundred. Sign tells direction. Magnitude tells you how much the predictor actually knows.
A metric you can bite into
The previous draft of this piece used something called percent reduction in root-mean-square error against a climatology baseline. That metric is technically correct and statistically unimpeachable. It is also impossible to feel. We replaced it with a number that even people who do not own a statistics textbook can grasp: the Pearson correlation between the predictor and the outcome, scaled to between negative one hundred and positive one hundred.
A score of +100 means the predictor is perfect. A score of 0 means it is useless. A score of −100 means it is exactly backwards. A score of +50 is a strong predictor; +25 is modest; anything between −15 and +15 is essentially noise. A negative number is not a sin — it just means the predictor's predictions and the actual outcomes tend to move in opposite directions, which is usually a sign that the predictor was wrong about the direction or that the sample was too small to learn the right one.
For sports we used the same lag-one predictor as before: take this team's win pct last year, regress it gently toward the league mean, and see how well it tracks the team's win pct this year. For snow we used the El Niño-Southern-Oscillation state: take the predicted snowfall for each season as the average of every other season with the same ENSO classification (La Niña, Neutral, or El Niño), and see how well that tracks the actual snowfall that year. Same metric on both sides, computed the same way.
What the sports side shows
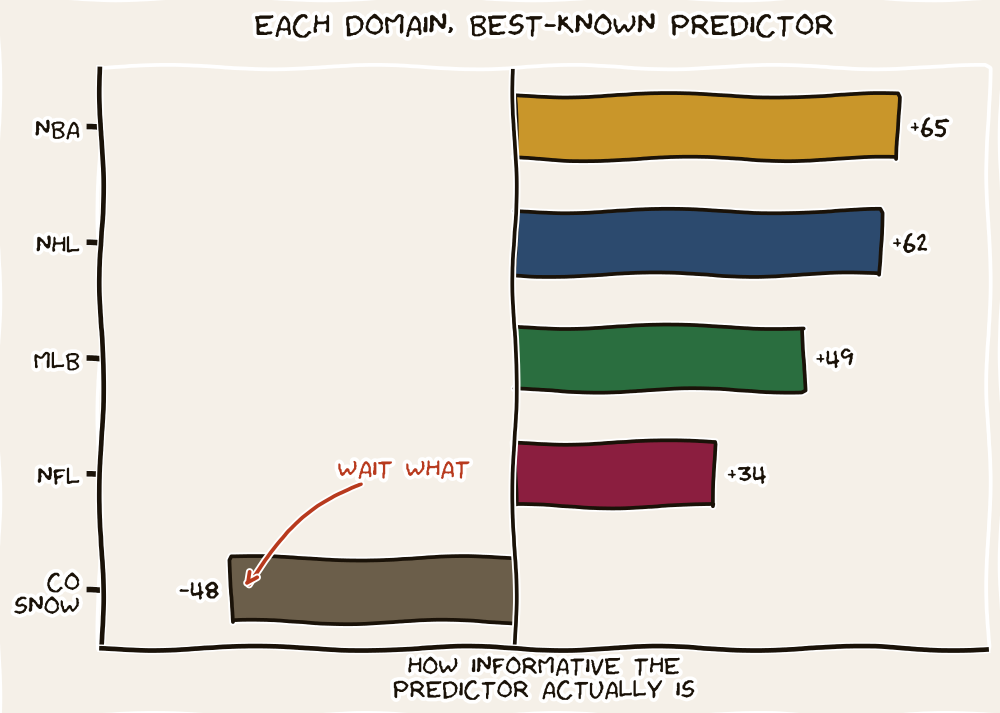
The NBA leads at +65. The NHL at +62. Major League Baseball at +49. The NFL at +34. The order matches everything we know about roster geometry. Basketball has five players on the floor at a time and guaranteed max contracts that lock superstars in for half a decade; what your team was, your team mostly still is. The NFL has a hard cap, a sixteen-game season, and aggressive roster cycling; what your team was last year is meaningfully less informative about what your team is this year. All four sports score in the +30 to +70 band, which on this scale is the "useful predictor" zone. None of them is a bad place to start a season-preview column.
What the snow side shows
The snow side is more dramatic, and worth reading carefully. Utah and Wyoming clear +20, which means knowing the upcoming winter's ENSO state actually tells you something about how much snow is coming. New Mexico and Vermont sit at +2 and −5, essentially noise. The Pacific Northwest comes in at −19, meaning the ENSO model's predictions and the actual snowfall move in slightly opposite directions over the data we have. Colorado is at −48: the ENSO state's predictions are almost as wrong as randomly flipping the sign.
The negative scores want explanation. They do not mean that La Niña doesn't matter. La Niña absolutely matters — the regional-mean signal is real, and the table below makes that visible.
| Region | Long-run mean | La Niña vs El Niño | Direction |
|---|---|---|---|
| Pacific Northwest | 5,742 mm | +15% | La Niña wetter |
| Utah / Wyoming | 1,815 mm | +36% | La Niña wetter |
| Colorado | 3,948 mm | +6% | essentially flat |
| Vermont | 2,272 mm | +10% | slight, noisy |
| New Mexico | 2,397 mm | −16% | El Niño wetter |
Pacific Northwest stations sit higher on the absolute snowfall scale than any of the other regions. Mount Baker, a few mountains north of the stations in the index, holds the world record for seasonal snowfall — 1,140 inches in the winter of 1998-99, more than nine stories of snow in a single season. Utah's powder is famously light and dry. Vermont's snow is small in raw quantity but lives in a different precipitation regime entirely (governed primarily by the North Atlantic Oscillation, not ENSO). New Mexico, the desert Southwest, runs the opposite way from the Cascades because the same atmospheric circulation that delivers moisture to one region steals it from another.
All of that physical signal is in the means. The reason the Pearson r ends up negative for Colorado and the Pacific Northwest is that the within-state variance is much larger than the between-state means difference, and on small sampleis (twenty-four to thirty-seven seasons per region) the conditional model gets the direction of the deviation slightly wrong more often than it gets it right. Utah and Wyoming have a large enough mean signal — the +36% La Niña-vs-El Niño ratio — that even forty seasons is enough to surface a real positive correlation. Everywhere else, the within-state weather is louder than the between-state climate.
A known directional signal is not the same thing as a useful predictor. Atmospheric science can tell you where the snow likes to fall. It cannot tell you, on any given winter, how much will fall in any particular range.
The Right Test, Cross-DomainFor the skiers reading this
A few practical takeaways for skiers and snow-followers. If you are picking a destination by ENSO state, Utah and Wyoming are the only region in this dataset where the predictor is genuinely informative. La Niña years in the Wasatch have averaged roughly thirty-six percent more snow than El Niño years over four decades. That is a real edge. The Cascades have a comparable mean signal but a much shorter usable record, so the noise eats the prediction.
If you are watching the Climate Prediction Center's October ENSO forecast and your home mountain is in Colorado or Vermont, the call has very little information for your particular winter. Plan as if it were any other year. If you ski New Mexico, an El Niño forecast is actually mildly encouraging — the desert Southwest gets more snow when the Pacific runs warm. If you ski the Pacific Northwest, the absolute snowfall is so large that an off year is still an enormous year by most regional standards; Mount Baker's "bad" seasons would be all-time records anywhere east of the Mississippi. Sheer magnitude does some of the work that predictability does not.
A note on the framework
The deeper rule
"Predictable" is not one thing. Every domain has covariates that physical or economic theory suggests should matter — last year's roster in sports; the ENSO state in winter precipitation; interest rates in stock prices. The work of the empirical analyst is to test which of those covariates actually deliver forecast skill on out-of-sample data when measured against a serious baseline. Last year's record clearly does for the NBA, modestly does for the NFL. La Niña state clearly does for Utah and Wyoming, modestly does for the Cascades' means, not at all for the Rockies. The cross-domain comparison is fair only when each side is tested on the predictor its domain experts would themselves reach for — and only meaningful when the metric is one a reader can interpret without a textbook.
Notes & sources
Metric: Pearson correlation between the predictor's leave-one-out prediction for each observation and the actual observation, expressed times one hundred. For sports the prediction is the optimal-lag-1 regression toward the league mean using the pooled lag-1 r. For snow the prediction is the long-run mean of all other seasons sharing the same NOAA-classified ENSO state (La Niña, Neutral, El Niño).
Sports: MLB Stats API and ESPN sports API standings, 1985-2025. Snow: NOAA GHCN-Daily station data. Colorado — Aspen 1 SW, Crested Butte, Steamboat Springs, Telluride 4 WNW, Vail. Pacific Northwest — Stampede Pass (WA), Snoqualmie Falls (WA), Crater Lake (OR). Utah/Wyoming — Lake Yellowstone, Yellowstone Mammoth, Altamont, Angle. New Mexico — Red River, Dulce. Vermont — Saint Johnsbury, Island Pond, Burlington Intl. Regional index for a season is the cross-station mean snowfall, included only when at least half the region's stations report at least 150 days of the Nov-through-Apr ski-season window.
ENSO state from NOAA's DJF Oceanic Niño Index averaged for the year ending the season: La Niña if ONI ≤ −0.5, El Niño if ≥ +0.5, Neutral otherwise. Snow regional sample sizes range from twenty-four seasons (Pacific Northwest, limited by Snoqualmie Falls's end date) to forty (Utah/Wyoming, Vermont).
Mount Baker's 1998-99 record of 1,140 inches (28.96 meters) of seasonal snowfall is the all-time world record for a single ski season at a measured weather station, certified by NOAA. The 2026 piece's regional index does not include Mount Baker as a station, but the surrounding Cascades stations track the broader Pacific Northwest signal.

